
Benchmarks
Real numbers from uteke bench on Oracle Cloud ARM (Ampere A1, 4 vCPU, 24GB RAM). Embedding model: EmbeddingGemma Q4 (768d, ONNX Runtime, CPU-only).
Results
Re-verified on the v0.17.0 release binary (2026-09-09, native aarch64 build, full run):
| Scale | Insert ops/s | Insert Total | Recall Avg | Recall P95 | DB Size | Index Size |
|---|---|---|---|---|---|---|
| 100 memories | 17.3/s | 5.8s | 31ms | 47ms | 0.7MB | 0.31MB |
| 1,000 memories | 17.5/s | 57s | 42ms | 62ms | 5.2MB | 3.10MB |
| 10,000 memories | 5.0/s | 33.4 min | 31ms | 38ms | 80.7MB | 30.2MB |
Historical table (2026-08 run, v0.12.0-era, as originally published)
| Scale | Insert ops/s | Insert Total | Recall Avg | Recall P95 | DB Size | Index Size |
|---|---|---|---|---|---|---|
| 100 memories | 18.5/s | 5.4s | 40ms | 46ms | 708KB | 319KB |
| 1,000 memories | 21.8/s | 45.9s | 45ms | 51ms | 5.3MB | 3.2MB |
| 10,000 memories | 6.0/s | 28.0 min | 42ms | 50ms | 81.3MB | 30.3MB |
Storage matches the v0.17.0 run within a fraction of a percent.
Key Takeaways
Recall Latency: Flat ~30-45ms from 100 to 10K memories
The killer stat: recall latency barely changes as the store grows.
- 100 memories → 31ms
- 1,000 memories → 42ms
- 10,000 memories → 31ms ← actually faster than 1K (warm ONNX cache)
HNSW search is O(log N), so even at 10K memories, the vector index adds <1ms. The floor is dominated by ONNX embedding inference, not search. We quote ~45ms in the headline as a conservative upper bound.
The full pipeline (fusion strategy, default since 0.16.0):
- Query → ONNX embedding generation
- HNSW vector search → vector ranking
- FTS5 full-text search + RRF (k=60) → hybrid ranking
- Weighted RRF fusion of the two rankings (#1123, tuned weights)
Retrieval quality (LongMemEval fast50, session-level): fusion R@5 0.98 vs hybrid 0.9267 vs vector-only 0.854. Vector and hybrid fail on disjoint question sets — fusing captures both sides' wins.
No network round-trip. No API call. Everything in-process.
Insert Throughput: 6-22 ops/s (CPU-bound)
Each insert requires an ONNX embedding pass (CPU inference). Throughput drops at scale because HNSW graph traversal grows as the index expands:
- 100 memories → 17.3 ops/s
- 1,000 memories → 17.5 ops/s
- 10,000 memories → 5.0 ops/s (within run-to-run noise of the earlier 6.0)
At 5 ops/s, inserting 10K memories takes ~33 minutes. For bulk ingestion, use uteke import (batch mode) which pipelines embeddings.
Storage Efficiency
- 100 memories → 0.7MB DB + 0.31MB index = ~10KB per memory
- 1,000 memories → 5.2MB DB + 3.1MB index = ~8.3KB per memory
- 10,000 memories → 80.7MB DB + 30.2MB index = ~11.1KB per memory
Storage scales linearly (~10KB/memory). SQLite + HNSW both grow predictably.
How to Reproduce
uteke bench --counts 100,1000,10000 --jsonOr with a custom store path:
uteke bench --counts 100,1000 --store /tmp/bench --jsonExternal Evaluation
See LongMemEval retrieval harness for accuracy evaluation against standard benchmarks.
LongMemEval-S — Retrieval Accuracy (500 questions)
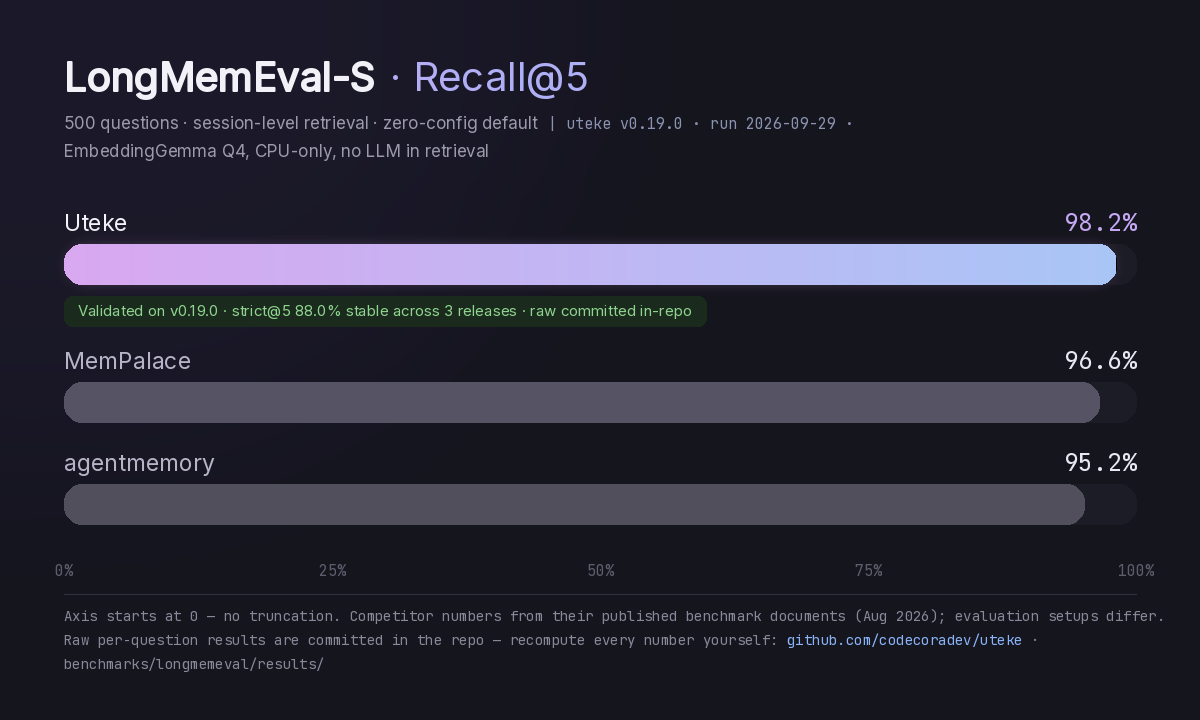
Full-validation runs of the default strategy (fusion, zero-config) on LongMemEval-S: 500 questions, session-level retrieval, ~115 haystack sessions per question (2,415 unique sessions), EmbeddingGemma Q4 CPU-only, deterministic — no LLM anywhere in the retrieval path. Originally validated on v0.16.0, re-validated end-to-end on the v0.17.0 release binary (2026-09-09), and re-validated again on the v0.19.0 release tree (2026-09-29).
Headline numbers
Full 500-question basis, all three validated releases (scored from the committed raw artifacts):
| Metric | v0.16.0 | v0.17.0 | v0.19.0 | What it means |
|---|---|---|---|---|
| recall_any@5 | 98.2% | 98.4% | 98.2% | At least one gold session in top-5 — the metric competitor benchmarks publish |
| recall_any@10 | 98.8% | 98.8% | 98.8% | |
| strict recall_all@5 | 88.0% | 88.0% | 88.0% | Strict: every gold session in top-5 (mathematical ceiling 99.4% — 3 questions have 6 gold sessions) |
| strict recall_all@10 | 95.4% | 95.4% | 95.4% | Every gold session in top-10 |
| coverage@5 | 94.3% | 94.4% | 94.3% | Partial credit per question |
The strict family (88.0 / 95.4) is bit-stable across all three releases; recall_any@5 sits in a ±0.2pp band (98.2–98.4) with zero flips @10/@50 and one rank-boundary flip @5 between v0.17.0 and v0.19.0 (details).
On the 470 non-abstention questions (the 30 _abs abstention questions are reported separately), strict recall_all@5 is 88.3% and coverage@5 is 94.6%. Per-type breakdown, ablations, and the contradiction segment: benchmarks/longmemeval/RESULTS.md.
Gold-session distribution across the 500 questions: 1 gold ×176, 2 ×250, 3 ×41, 4 ×19, 5 ×11, 6 ×3. 65% of questions have multiple gold sessions — which is why we report the strict family at all.
Why two metric families
recall_any@K passes a question when at least one gold session is retrieved. It is the de-facto industry metric — and the one every competitor number in the chart above uses. But a question whose answer needs evidence from 3 sessions is only truly solved when all 3 are retrieved. recall_all@K measures exactly that. It is harder, bounded below recall_any, and to our knowledge no other system in the comparison publishes it. We report both, from the same run, with the same data.
Head-to-head vs published systems
The agentmemory numbers quoted in the README are their published figures on the same benchmark and the same 500-question split, on their own recall_any@5 basis — verified apples-to-apples before quoting (their harness, their split, their metric definition). The BM25-only column is their published lexical baseline, not our system. Our own FTS5 ablation on this dataset scores 91.4% any@5 (RESULTS.md).
Honesty notes
- The comparison chart mixes evaluation setups: uteke numbers come from our own harness on
longmemeval-s(cleaned set); competitor numbers are from their published benchmark documents (accessed Aug 2026) and differ in embedding models and pipeline details. - The FTS5-only bar is an ablation of our own system, not a competitor.
- Aggregate metrics + per-type breakdown: benchmarks/longmemeval/RESULTS.md in this repo. Canonical raw per-question artifacts are committed under benchmarks/longmemeval/results/ (default 500-question runs for v0.16.0, v0.17.0 and v0.19.0, FTS5 ablation, contradiction segment) — recompute any headline number straight from the repo; older exploratory outputs live on the benchmark Modal volume (uteke-longmemeval).
Reproducibility
An independent local re-run (2026-09-01) of 108 of the 500 questions on a 4-core ARM desktop reproduced the published Modal x86 run: 107/108 questions produced identical per-question rankings. The single difference was an adjacent-rank near-tie (identical top-10 set, one gold session swapped ranks 5-6) from cross-architecture floating-point noise. Aggregate R@5 on the subset: 96.7% / 99.4% (re-run) vs 96.7% / 100.0% (published). See the Independent Reproduction section in RESULTS.md for the full table and reproduction command.
Environment
| Component | Details |
|---|---|
| Hardware | Oracle Cloud ARM (Ampere A1, 4 vCPU, 24GB RAM) |
| OS | Linux 6.8.0 (aarch64) |
| Rust | 1.85+ |
| Embedding | EmbeddingGemma Q4, 768d, ONNX Runtime CPU |
| Uteke | v0.16.0 validation + v0.17.0 re-validation (2026-09-09) + v0.19.0 re-validation (2026-09-29), all full 500 questions; perf table re-verified on v0.17.0 |
Methodology
The benchmark uses uteke bench which:
- Generates deterministic synthetic memories (seeded PRNG)
- Inserts them one-by-one with embedding
- Runs recall queries at each scale
- Measures wall-clock time for insert and recall
- Reports ops/s, latency percentiles, and storage footprint
No external services. No network. No Docker. Just the binary.